CloudExpat Major Release: Public API, GitHub Action & AWS RI/SP Insights

This release adds a public API (cost + carbon) built for CI/CD, a GitHub Action workflow for automated reporting, and AWS Reserved Instance / Savings Plan recommendations with 30–72% savings potential — plus an All Accounts view and per-account data quality indicators.
Executive Summary
Today’s CloudExpat release is a big step toward automated FinOps: you can now pull cost + carbon programmatically via a public API, generate reports as JSON or Markdown, and drop them straight into CI/CD (including GitHub workflows).
We’re also shipping AWS Reserved Instance + Savings Plan recommendations (with direct navigation to AWS Console purchase flows), an All Accounts global view, and per-account data quality indicators so teams can quickly understand which accounts need configuration for accurate reporting.
What’s New (At a Glance)
| Feature | Who it’s for | Why it matters |
|---|---|---|
| Public API (Cost + Carbon) | Platform/DevOps, FinOps engineers | Automate reporting and guardrails in CI/CD with consistent, machine-readable data |
| API Keys UI | Admins / operators | Self-serve key creation + rotation without support tickets |
| GitHub Action Integration | Engineering teams | Add cost & carbon visibility to PRs and pipelines (the fastest feedback loop) |
| AWS RI / Savings Plan Recommendations | FinOps, CFO/FP&A, cloud owners | Identify commitment opportunities with 30–72% savings potential and take action |
| All Accounts Global View | Execs, FinOps, multi-team orgs | See totals across connected accounts in one place |
| Data Quality Indicators | Everyone | Know how “trustworthy” the numbers are per account and what to fix |
1) Public API for Cost & Carbon (Built for CI/CD)
CloudExpat now exposes a REST API at data.cloudexpat.com for programmatic access to your cloud cost and carbon data.
Key Endpoints
| Endpoint | Output | Use case |
|---|---|---|
GET /v1/costs/summary | JSON | Pull cost totals + comparisons for dashboards, alerts, PR checks |
GET /v1/carbon/summary | JSON | Track emissions trends and tie them back to spend |
GET /v1/report | JSON or Markdown | Generate a human-friendly report or post it into PR comments |
For authentication details, request/response formats, and code examples, see the API Reference.
Why this matters: FinOps only works when the feedback loop is fast. If cost and carbon insights show up after something ships, teams treat it as noise. When it shows up during development (PRs and pipelines), it becomes a habit.
2) GitHub Action Integration: Cost & Carbon Where Engineers Actually Look
Instead of asking engineers to “go check a dashboard,” you can bring CloudExpat reporting into the workflow they already live in: pull requests.
Typical patterns teams implement:
- PR visibility: post actual cloud costs (not estimates) directly to PRs
- Release gating: fail a pipeline if projected monthly cost crosses a threshold
- Weekly reporting: auto-post a Markdown report into Slack/Teams via your existing automations
The action is available on GitHub Marketplace. For setup instructions and configuration options, see the GitHub Action guide.
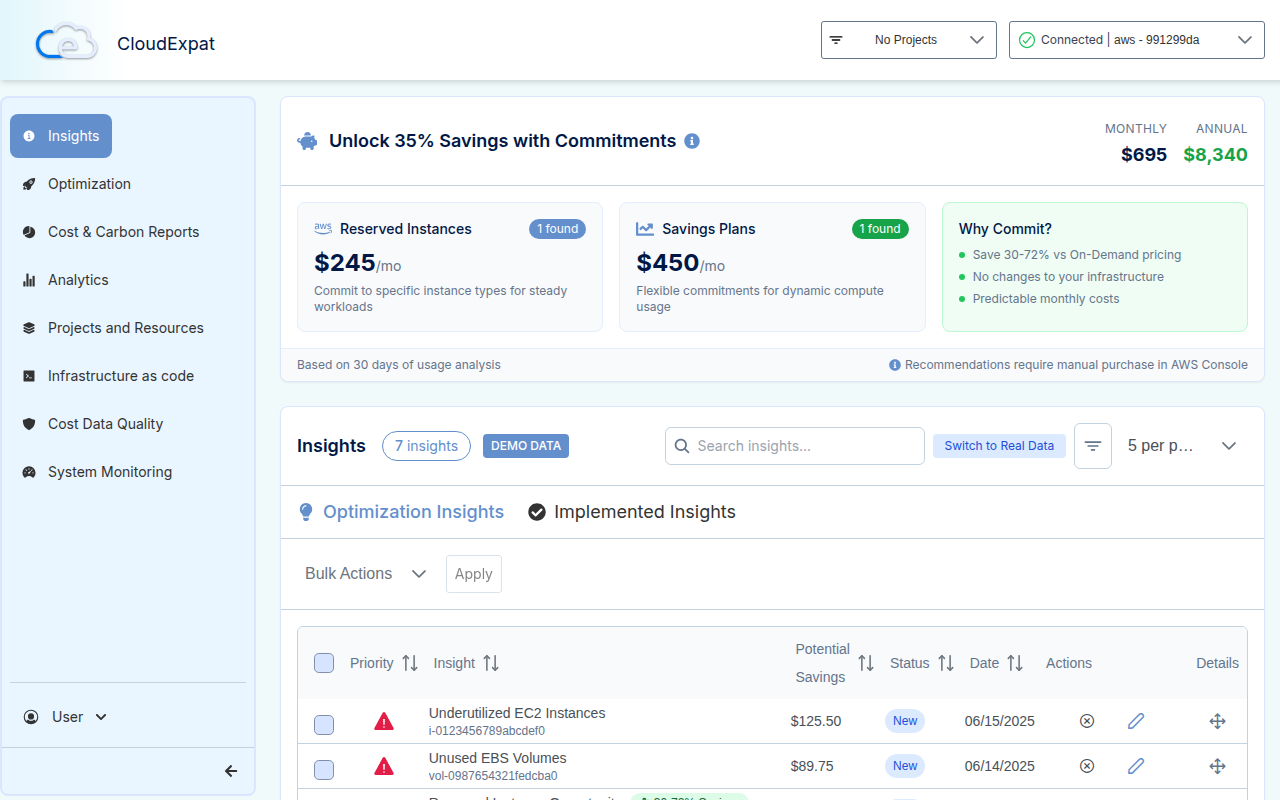
3) AWS Reserved Instance & Savings Plan Recommendations (30–72% Potential Savings)
For AWS customers, this release adds end-to-end Reserved Instance (RI) and Savings Plan (SP) recommendations powered by AWS Cost Explorer recommendation APIs:
- Reserved Instances: EC2, RDS, ElastiCache, Redshift, Elasticsearch
- Savings Plans: Compute, EC2, SageMaker
How CloudExpat Filters Noise
To keep recommendations actionable (not overwhelming), we apply thresholds like:
- Minimum savings: $50/month
- Minimum savings percentage: 15%
- Deduplication logic to avoid duplicate insights
What You’ll See in the UI
- A dedicated insight card with recommendation details
- A roll-up banner showing total savings potential
- Direct navigation to AWS Console purchase flows (so it’s easy to act)
Why this matters: Commitment-based savings are where mature FinOps programs find big wins—but only if the recommendations are visible, trusted, and easy to execute.
4) All Accounts Global View (Multi-Account Totals)
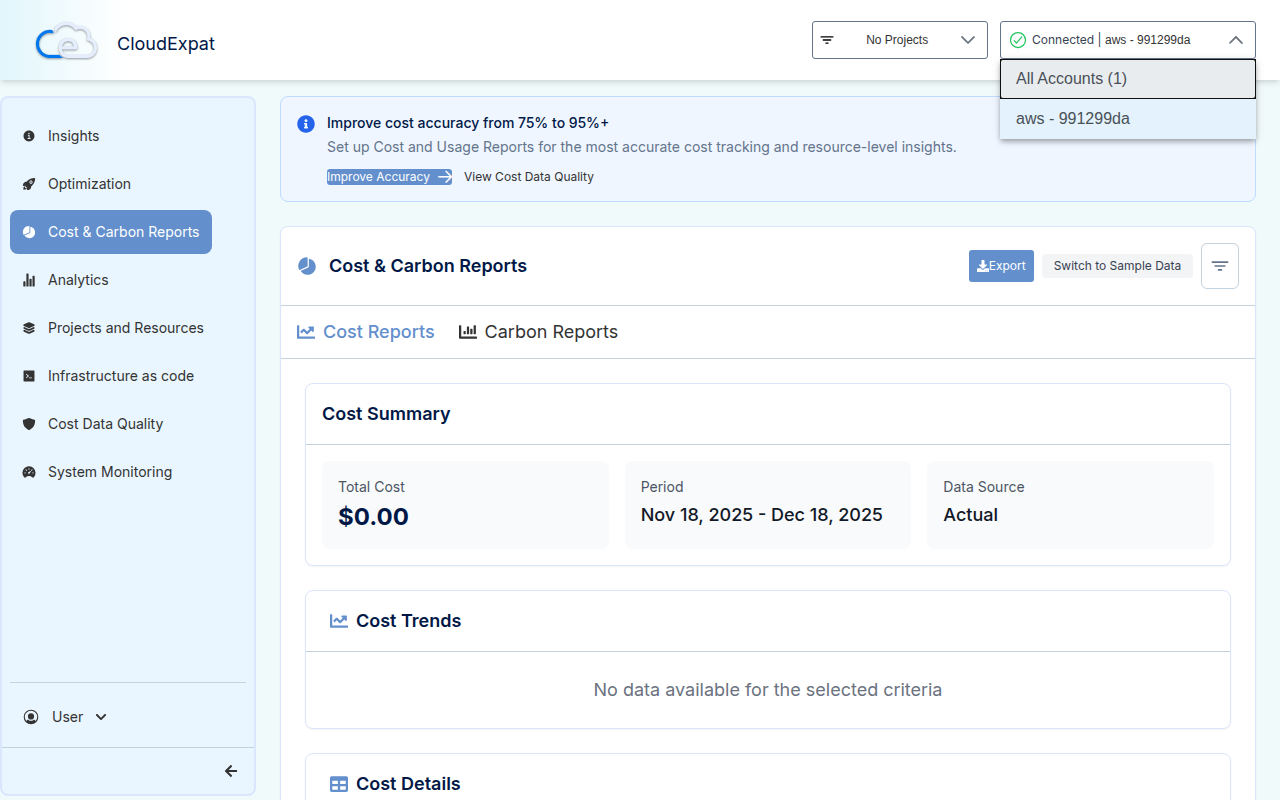
You can now switch the account selector to All Accounts to view aggregate cost and carbon across your connected cloud accounts.
This is especially useful for:
- CFO / finance owners looking for one number
- Platform teams managing multiple environments (prod/stage/dev)
- Orgs with multiple business units under different cloud accounts
5) Per-Account Data Quality Indicators (Trust the Numbers)
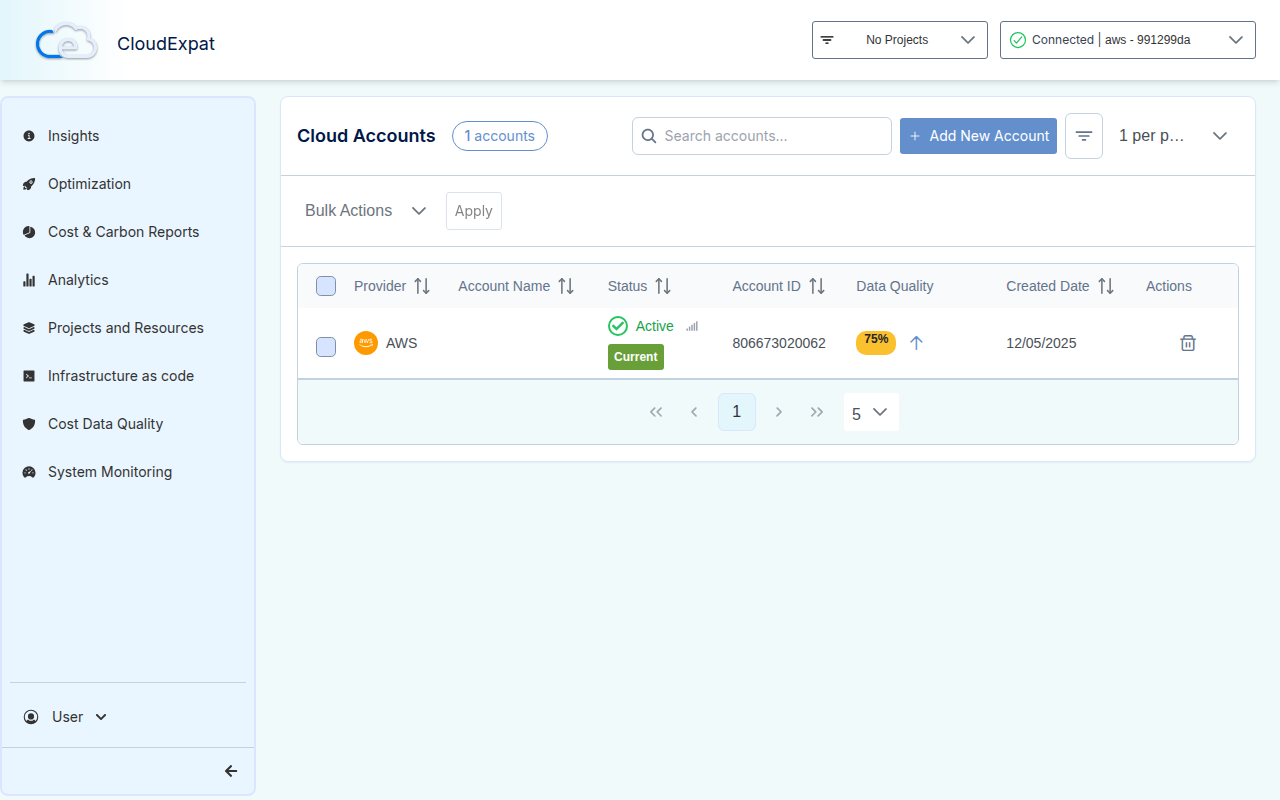
A cost dashboard is only helpful if you know whether the data is accurate.
This release adds data quality badges per account, plus a nudge banner and enhancement flows to help teams improve accuracy across AWS/Azure/GCP.
What you get:
- Clear visual status indicators
- Guided “enhancement” setup prompts when data is incomplete
- Better handling for new accounts (including fallback signals like resource counts)
Why this matters: A “wrong” number is worse than no number. Data quality indicators prevent false confidence and shorten time-to-fix.
Reliability and Deployment Improvements
This release also included several behind-the-scenes changes that improve operational stability:
- Fixed a CloudFormation deployment blocker that could stall stacks in
UPDATE_IN_PROGRESSfor ~47+ minutes - Removed an AWS Budgets resource that could fail in linked accounts
- CI/CD improvements (Node 20 upgrade, dependency handling, streamlined pipeline steps)
Getting Started
- Create an API key in Settings > API Keys
- Add to CI/CD — follow the GitHub Action guide or use the API directly
- Review RI/SP recommendations as part of your monthly FinOps cadence
- Check data quality indicators to ensure your cost + carbon numbers are reliable
FAQ (SEO-Friendly)
Do Reserved Instances and Savings Plans really save money?
Yes—commitment discounts can be substantial, but only if the recommendations match your usage and you have stable workloads. CloudExpat highlights actionable opportunities (with minimum savings/percentage thresholds) to reduce noise.
What’s the difference between a cost report API and a dashboard?
Dashboards are great for humans. APIs are what you need for automation: CI/CD checks, alerts, scheduled reporting, and integrating cost controls into engineering workflows.
Can I track carbon emissions alongside cost?
Yes. The public API includes carbon summary endpoints, and reporting supports a combined cost + carbon report so teams can optimize both spend and footprint together.
Closing
If you’re building a serious FinOps practice, the goal is simple: make cost and carbon as visible—and as automated—as reliability and security.
This release moves CloudExpat directly into the engineering workflow (API + CI/CD), adds major savings levers (RI/SP), and improves executive visibility (All Accounts + data quality indicators).